


So President Barack Obama is back from Hawaii and the Los Angeles Times reports the president will trumpet his economic record. The Times reports:
Eager to stay on the offensive as new Republican majorities are seated in Congress, the president plans to take a more bullish economic message on the road next week in something of an early test drive of his State of the Union message.
During stops in Michigan, Arizona and Tennessee, Obama plans to draw a connection between actions his administration took early in his presidency and increasingly positive economic trends in sectors such as manufacturing and housing.
Wow. Talk about a Washington bubble. Is he really going to tout his economic record? That’s called leading with your chin, and maybe before he falls flat on his face, he might want to examine a new Joint Economic Committee report card on Obamanomics.
On almost every measure examined, the 2009-2015 recovery since the recession ended in June of 2009 has been the meekest in more than 50 years.
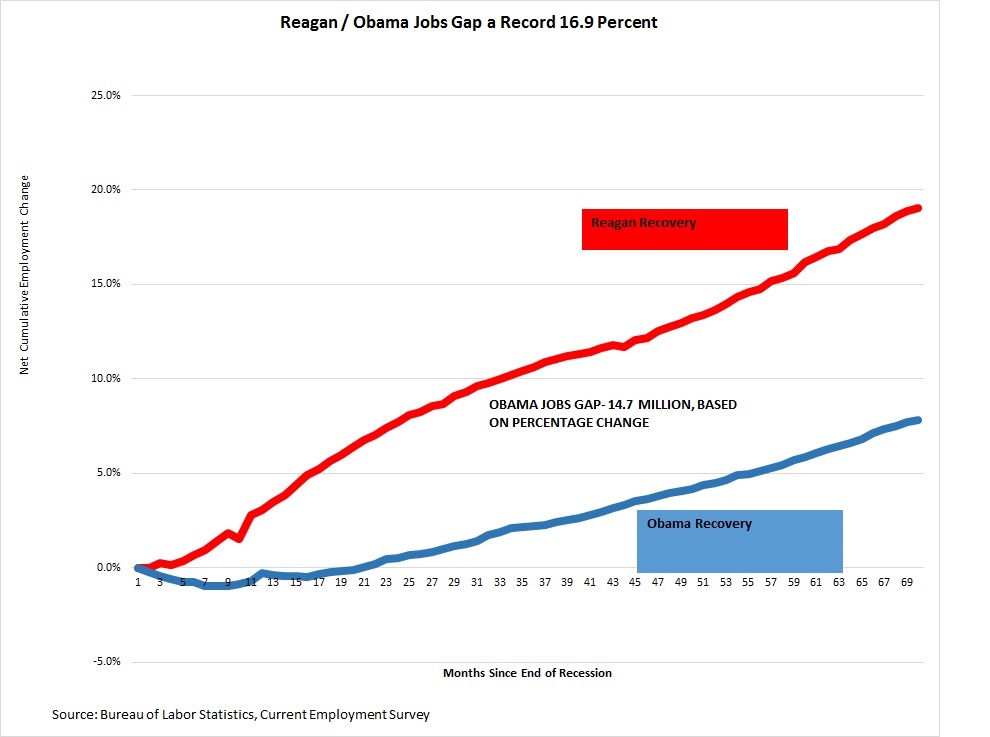
Start with the broadest measure of economic progress: growth in output. The chart below compares the Obama growth pace with that of the average recovery coming out of the last eight recessions and with the Reagan recovery and over the same number of months (77). Democrats used to disparage the Reagan expansion as nothing special, yet the growth rate over the first 25 quarters under Reagan was 34 percent versus 14.3 percent under Obama.
Source: Forbes.com
How much does this matter? If we had grown at an average pace, GDP in 2015 would have been about $1.8 trillion higher. Under the Reagan recovery growth it would have been almost $2.8 trillion higher.
It is certainly true that every recession is different in cause and consequences, so the JEC dug deeper into the numbers. It examined GDP growth on a per capita basis. The Reagan recovery was abnormally strong in part because it happened when millions of baby boomers swept into the workforce, adding to growth. But even on a per capita basis, real GDP has grown only 9 percent versus 18.8 percent for the average recovery. That is the lowest of any post-1960 recovery.
Next the JEC measured job market trends. Again we see a failing record. Yes, official unemployment of just over 5 percent today is very low. But that’s the biggest lie in America–right up there with “we’re from the government and we’re here to help.”
The distortion is due to the fact that 94 million people in America over the age of 16 aren’t in the labor force. If job growth had been the same as the average recovery, we would have at least 5 million more Americans working—which is nearly the size of the workforce in Pennsylvania.
Amazingly, if we had had a Reagan-paced job recovery, we would today have at least 12 million more Americans working. Job creators are still on strike and it’s a result of EPA rules, Obamacare, tax hikes and other assaults against business.
When fewer people are working and wages are stagnant, incomes don’t grow. That’s the real sorry story of the Obama era. If the Obama recovery had been just average, in other words a C grade, JEC calculates that “after-tax per person income would be $3,339 (2009 dollars) per year higher.” Families can no longer be fooled with happy talk about “hope and change.” They feel the tough times.
The JEC’s dreary conclusion tells the whole story of the era of Obamanomics: ”On economic growth the Obama recovery ranks dead last.”
One other statistic that stands out on the Obama record as we begin his last year in office. The debt is nearly $19 trillion and by the time he leaves office our indebtedness will be almost double where it was when he entered the Oval Office. Just the interest payments alone cost half a trillion dollars a year.
This is the Obama legacy and if the White House wants to take ownership of this bleak record—it’s all theirs.