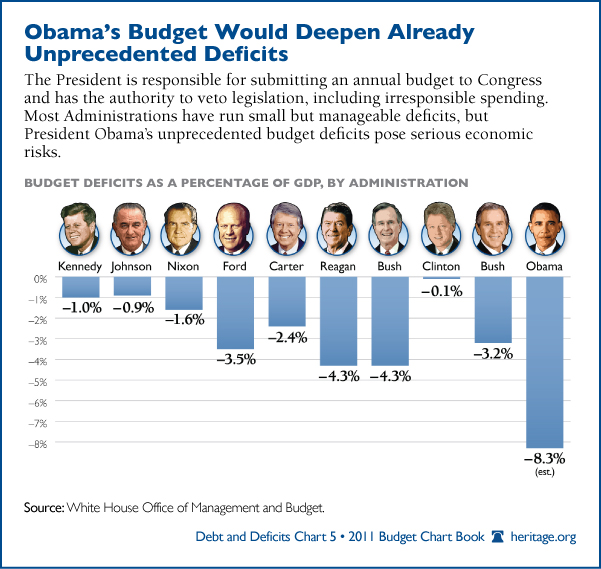
Chart of the Week: U.S. Presidents Ranked by Budget Deficits
Rob Bluey /
Over the past 50 years, 10 U.S. presidents have made annual budget requests to Congress, projecting deficits both big and small. But no other president compares to Barack Obama when it comes to the size and scale of the current budget deficit facing the United States.
The country is facing an 8.3 percent estimated average national deficit of a two-term Obama administration — the biggest of the past 50 years. By comparison, the current estimate for Obama is nearly double the percentage under Presidents Ronald Reagan and George H.W. Bush — and they were fighting the Cold War.
Political party doesn’t tell the whole story, however. President Bill Clinton leads the pack of presidents since 1961, according to data from the White House Office of Management and Budget. Heritage put together this graphic as part of our Budget Chart Book.
So what does the current trajectory mean for the United States? We’re certainly no longer looking at a continuation of manageable deficits in the years to come. This is a dramatic change in the magnitude of annual shortfalls at the federal level. That’s one reason Heritage came up with a plan to fix the debt crisis.
If you have a suggestion for a chart we should feature in the future, please post a comment below, email us at [email protected], or send me at tweet @RobertBluey.

