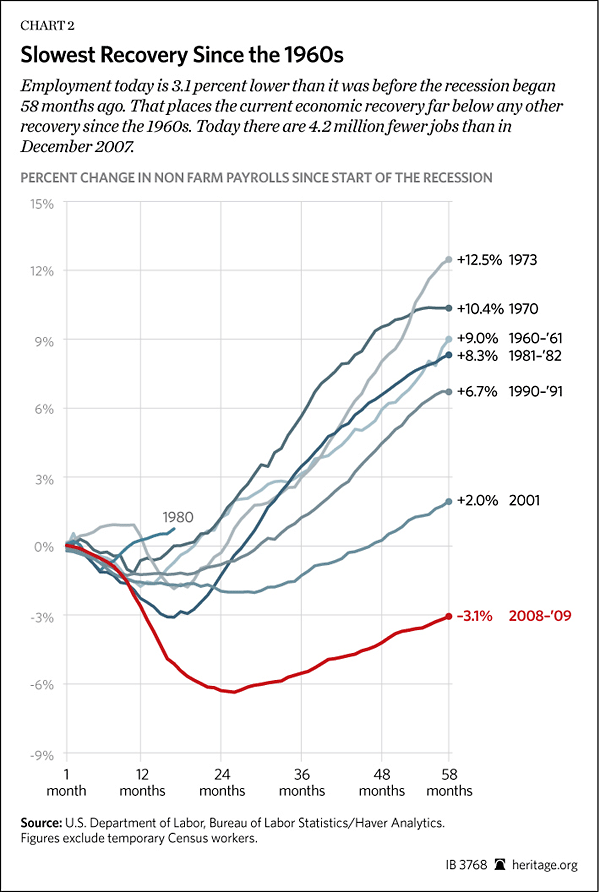
Chart of the Week: Slowest Economic Recovery Since the 1960s
Rob Bluey /
Americans could be waiting another five years for a return to normal employment based on the sluggish pace of the U.S. economy. After nearly four years in office, President Obama has overseen the worst recovery since the 1960s.
This week’s chart comes on the heels of Friday’s employment report, which showed an uptick in the unemployment rate to 7.9 percent. The labor market added 171,000 jobs in October, a pace that won’t result in full employment until 2017, according to Heritage’s Rea Hederman and James Sherk. They explain:
Normally, the economy grows rapidly after a severe recession. Entrepreneurs and investors typically find new ways to employ idled workers productively. In every recession in the post-war era—including the more severe 1981–1982 recession—employment fully recovered within four years of the recession’s onset. That has not happened in this recovery. Employers have 4.2 million fewer workers on their payrolls than they did in December 2007.
The 7.9 percent unemployment rate today is higher than when Obama took office in January 2009. And as Heritage’s J.D. Foster reminds us, the numbers paint a dismal picture for Obama’s record on job creation:
President Obama promised during the 2008 campaign (and after) that under his policies, the economy would create millions of new jobs by the end of 2010. He also insisted that he be held accountable for these results, a request that may soon come to pass. By December 2010, the Obama jobs deficit—the difference between the Obama jobs target and actual payroll employment—stood at 8.3 million jobs. That was 8.3 million examples of how Obama’s policies, most especially his irresponsible deficit spending, have failed to deliver on his promised job creation.
Today the Obama jobs deficit stands at 7.7 million — a figure that Foster says is a “clear sign of failure.”

