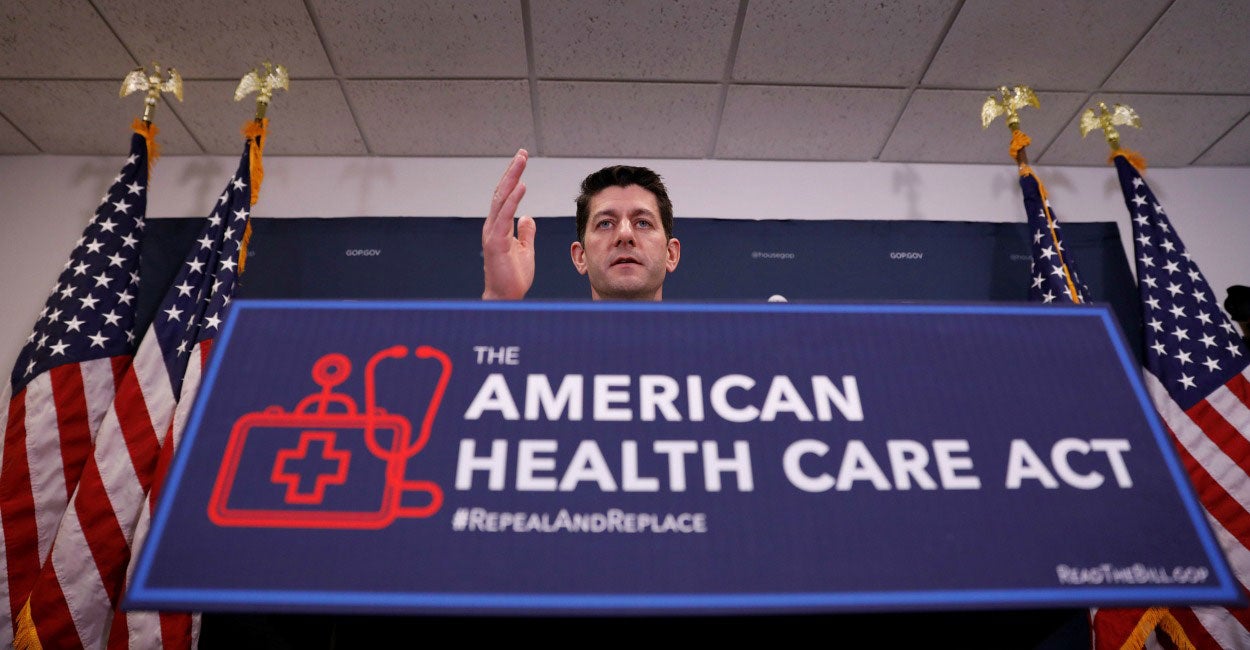
The Congressional Budget Office updated its score of the House-passed American Health Care Act this week, prior to its being sent over to the Senate.
This budgetary analysis projects that if passed into law, the bill would reduce the number of insured by 23 million, but would decrease the deficit by $119 billion while also reducing federal outlays by $1.1 trillion and federal revenue by $992 billion.
While the score is roughly similar to the score from the original version of the bill released on March 23, several modifications to the law occurred since then and were not reflected in earlier estimates.
The new CBO score addresses the effect of allowing states to waive the Affordable Care Act essential health benefit and community rating requirements on premiums in particular.
Effects on Coverage and Premiums
First, the CBO finds that 2 million fewer people in 2020 and about 1 million fewer in 2026 would become uninsured under the American Health Care Act.
TRENDING ARTICLES


It cites that this is due to “4 million more people with employment-based coverage, as employers in states making changes to market regulations would probably view the insurance products in the nongroup market as less desirable alternatives and decide to offer insurance to their employees, and 3 million fewer people with nongroup coverage, as some would enroll in employment-based coverage, and others would become uninsured.”
This is an interesting way to frame the effects of the bill, since reducing premium levels by rolling back regulations could actually have the effect of making plans more desirable for individuals looking to pay less.
The CBO lacks any real discussion of these positive effects.
As for premiums, the CBO finds the effects the same as previously estimated for roughly half the population, or for the people residing in states that did not pursue any waiver.
However, for the other half of the population, the CBO attempts to estimate the effects of different combinations of waiver decisions. It estimates that one-third of the population would be in states that make some changes to market regulations.
For these states, the CBO finds premiums to be 20 percent lower than under current law by 2026.
It also expects that these lower premiums would lead to more people having insurance, but fewer in the nongroup market—although “lower premiums could attract more enrollees to the nongroup market.”
About one-sixth of the population would reside in states that would substantially alter essential health benefits and waive community rating rules. For this population, the CBO projects “significantly lower premiums for those with low expected health care costs.”
However, it caveats that there is an issue of drastically raising premiums on higher-cost and older individuals in the market.
Ultimately, the CBO’s treatment of these effects could be more deeply analyzed. Most importantly, its methodology is relatively opaque, and ultimately includes an internal disagreement around whether or not lowering premiums leads to increased take-up in insurance coverage.
Regardless of these internal issues, the CBO still projects meaningful premium reductions by 2026 under the American Health Care Act, especially with moderate regulatory reforms.
Medicaid and State Exchanges
The largest projected savings in the bill come from reforms in Medicaid, along with the elimination of the Affordable Care Act’s subsidies in the individual market. The CBO’s score on Medicaid still reflects that it assumes more states would likely have expanded in the future under the Affordable Care Act.
Thus, its projection that 14 million fewer people would be insured due to not having Medicaid under the American Health Care Act might be overstated in all of its scores of the legislation.
Of that 14 million, 4 million will choose to be uninsured in 2018, which suggests the CBO’s methodology with regard to the effect of the individual mandate is unchanged from its original score of Obamacare.
In Medicaid, the CBO projects that these changes result in $834 billion savings from 2017-2026. There is little difference here between the past scores and the current.
Similar optimism from the CBO remains for the Affordable Care Act on the exchange side, as it is important to remember this number would be against a baseline that assumes the Affordable Care Act will enroll 7 to 8 million more people in the individual market, when in reality it does not appear this will be the case, as Avik Roy pointed out in response to the first score.
Nonetheless, savings from elimination of the Affordable Care Act’s subsidies is projected to amount to $665 billion in savings.
Key Takeaways
The CBO’s new score of the American Health Care Act has not changed much from the previous iteration besides incorporating views about how the states will respond to the available waivers, and incorporating the increased spending also included in the manager’s amendments.
While there might be disagreements about the coverage effects of state waivers, it is clear that there are meaningful premium reductions from allowing states to pursue them.
Given this, the CBO has still done nothing to address the inherent uncertainty involved in scoring large, complex pieces of health legislation by hiding large considerations behind opaque methodologies.
It also has still failed to walk back its overly optimistic views on the power of the individual mandate or the performance of Obamacare moving forward.

Read the first chapter of The Woketopus right now for FREE
Today, even with President Trump’s victory, leftist elites have their tentacles in every aspect of our government.
The Daily Signal’s own Tyler O’Neil exposes this leftist cabal in his new book, The Woketopus: The Dark Money Cabal Manipulating the Federal Government.
In this book, O’Neil reveals how the Left’s NGO apparatus pursues its woke agenda, maneuvering like an octopus by circumventing Congress and entrenching its interests in the federal government.
You can read the first chapter of this new book for FREE in this eBook, The Woketopus: Chapter One using the secure link below.
TRENDING ARTICLES

The Daily Signal depends on the support of readers like you.
RELATED ARTICLES


Don’t miss the