


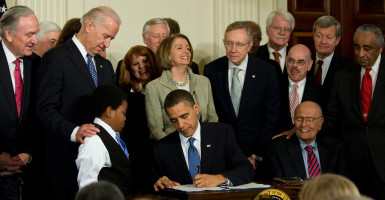

Six years ago Wednesday, President Barack Obama signed the Patient Protection and Affordable Care Act into law. Since then, Americans have seen their premiums increase, a dozen nonprofit insurers have closed their doors and the number of people on the Medicaid rolls has expanded.
Americans nationwide have both praised and cursed the law since the federal and state-run exchanges launched in October 2013.
Many credit the president with giving them access to coverage—the result of Obamacare’s provision prohibiting insurers from denying coverage based on pre-existing conditions. Others, meanwhile, have reported high premiums and deductibles, with the cost of their coverage increasing annually.
And for some, the cost of premiums has increased enough to leave them choosing between paying for insurance or paying the fine and going without.
Here are five graphs charting Obamacare’s six-year history.
1) The Cost of HealthCare.gov
Obamacare’s implementation in October 2013 came with the launch of HealthCare.gov, the federal health insurance exchange.
Just six people successfully signed up for health insurance on HealthCare.gov on Oct. 1, 2013, because of massive glitches and failures with the site. In the months that followed the disastrous launch, the Republican-led House of Representatives held numerous hearings to determine why the Obama administration decided to launch the website.
The Department of Health and Human Services fired CGI Federal, which was originally tasked with building HealthCare.gov, after the website’s launch and signed a new contract with Accenture to rebuild the exchange.
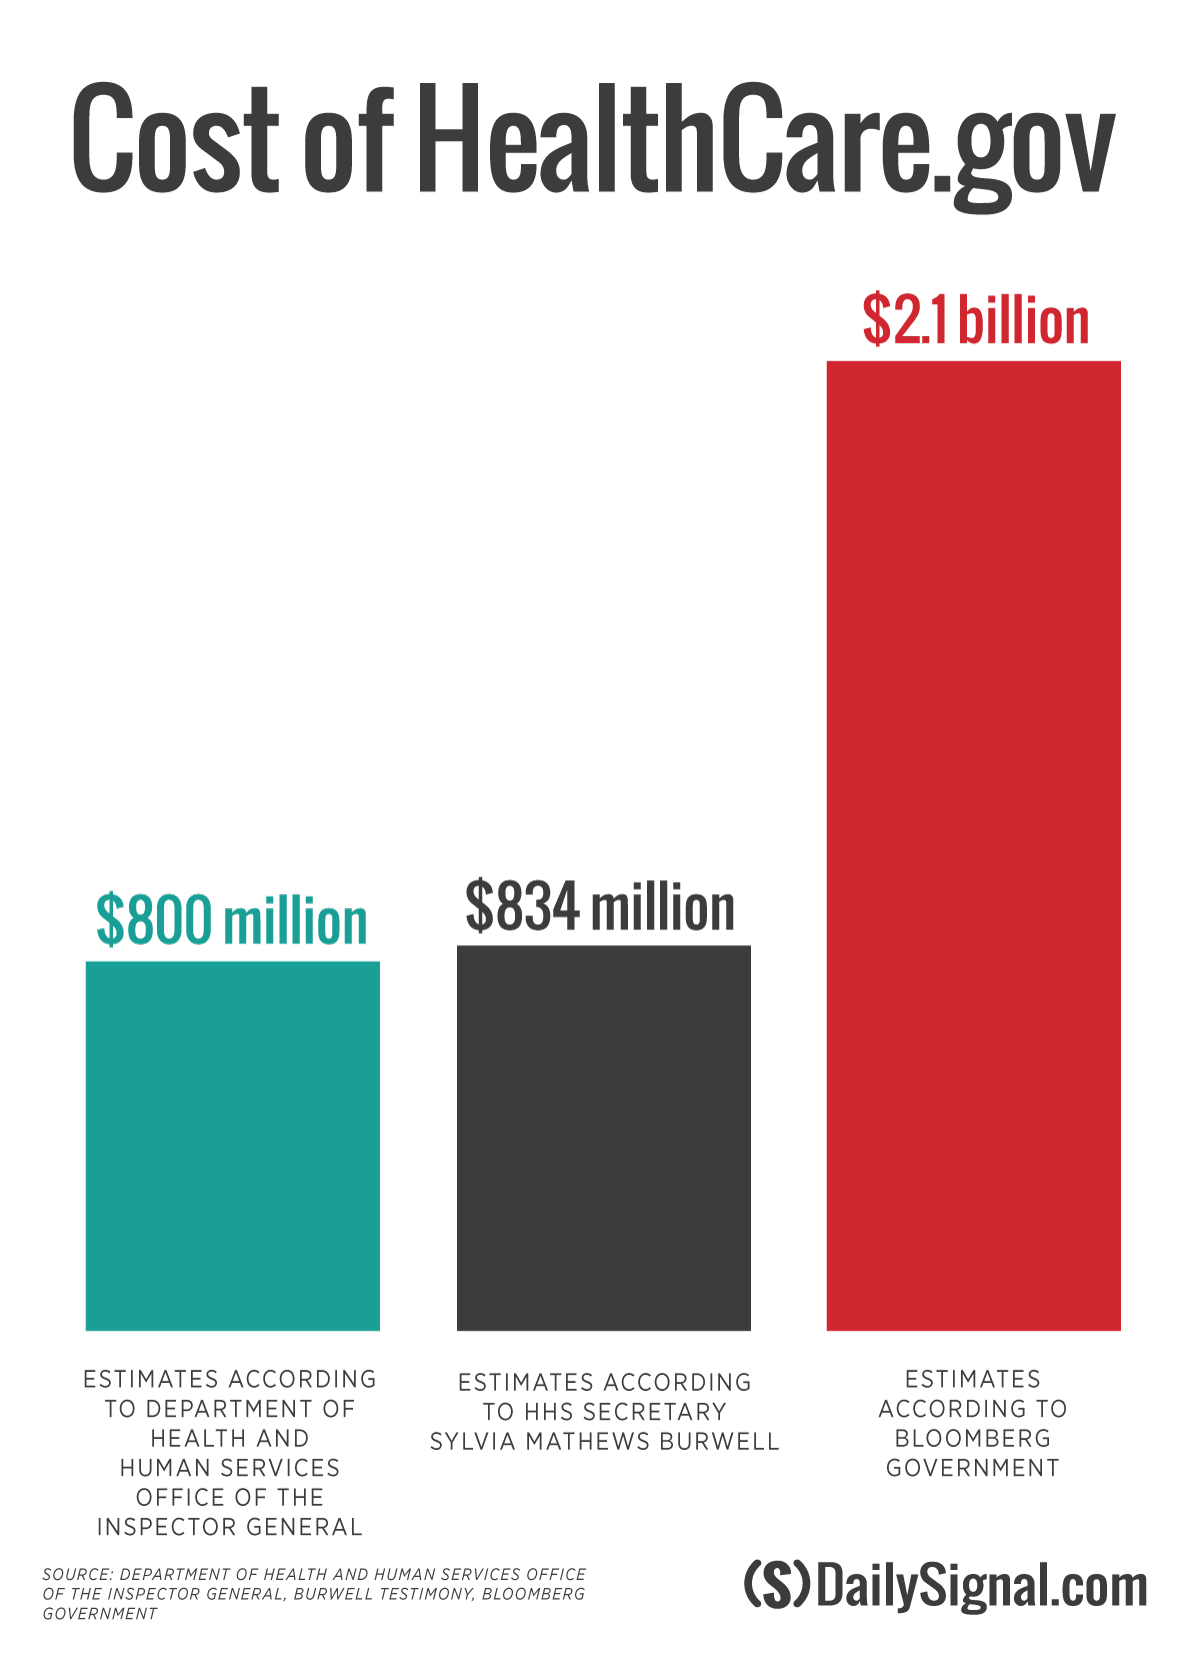
Though the Obama administration hasn’t formally said how much HealthCare.gov cost the taxpayers, Department of Health and Human Services Secretary Sylvia Mathews Burwell said last May that the website cost $834 million. Similarly, a report from the Department of Health and Human Services Inspector General put the cost of the exchange at $800 million.
An analysis by Bloomberg Government, though, put the total cost at $2.1 billion. Bloomberg Government took into account budgetary costs for the Internal Revenue Service and other government agencies, as well as contracts reworked to pay for the website.
2) Obamacare’s 2014 Enrollment Numbers
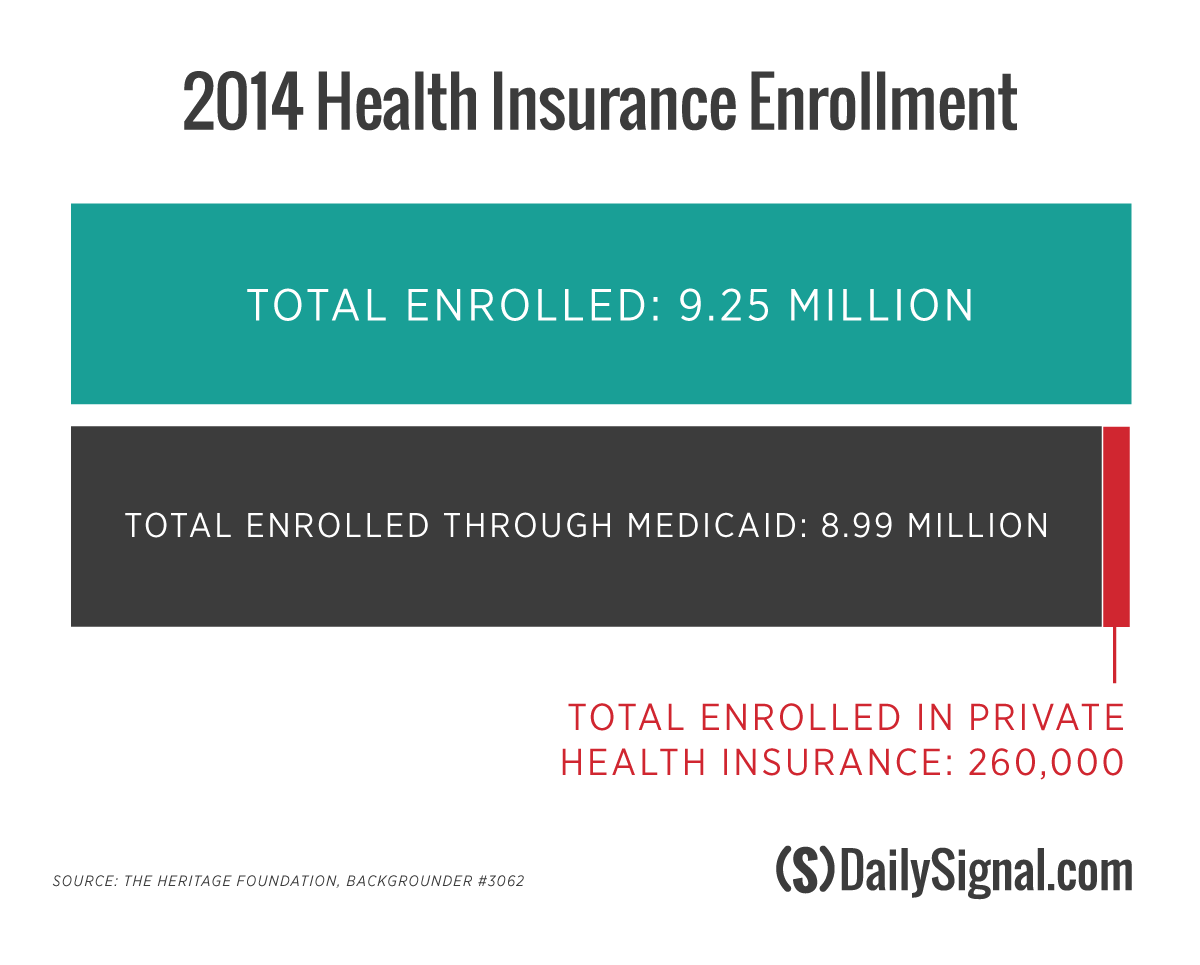
According to the Obama administration, 9.25 million consumers enrolled in coverage in 2014 on the federal and state-run exchanges. An analysis of enrollment figures conducted by Ed Haislmaier, a senior research fellow in health policy studies at The Heritage Foundation, and Drew Gonshorowski, a senior policy analyst at The Heritage Foundation, found that the majority of those enrollees qualified for Medicaid under Obamacare’s loosened eligibility requirements.
3) Obamacare’s Failed Co-Ops
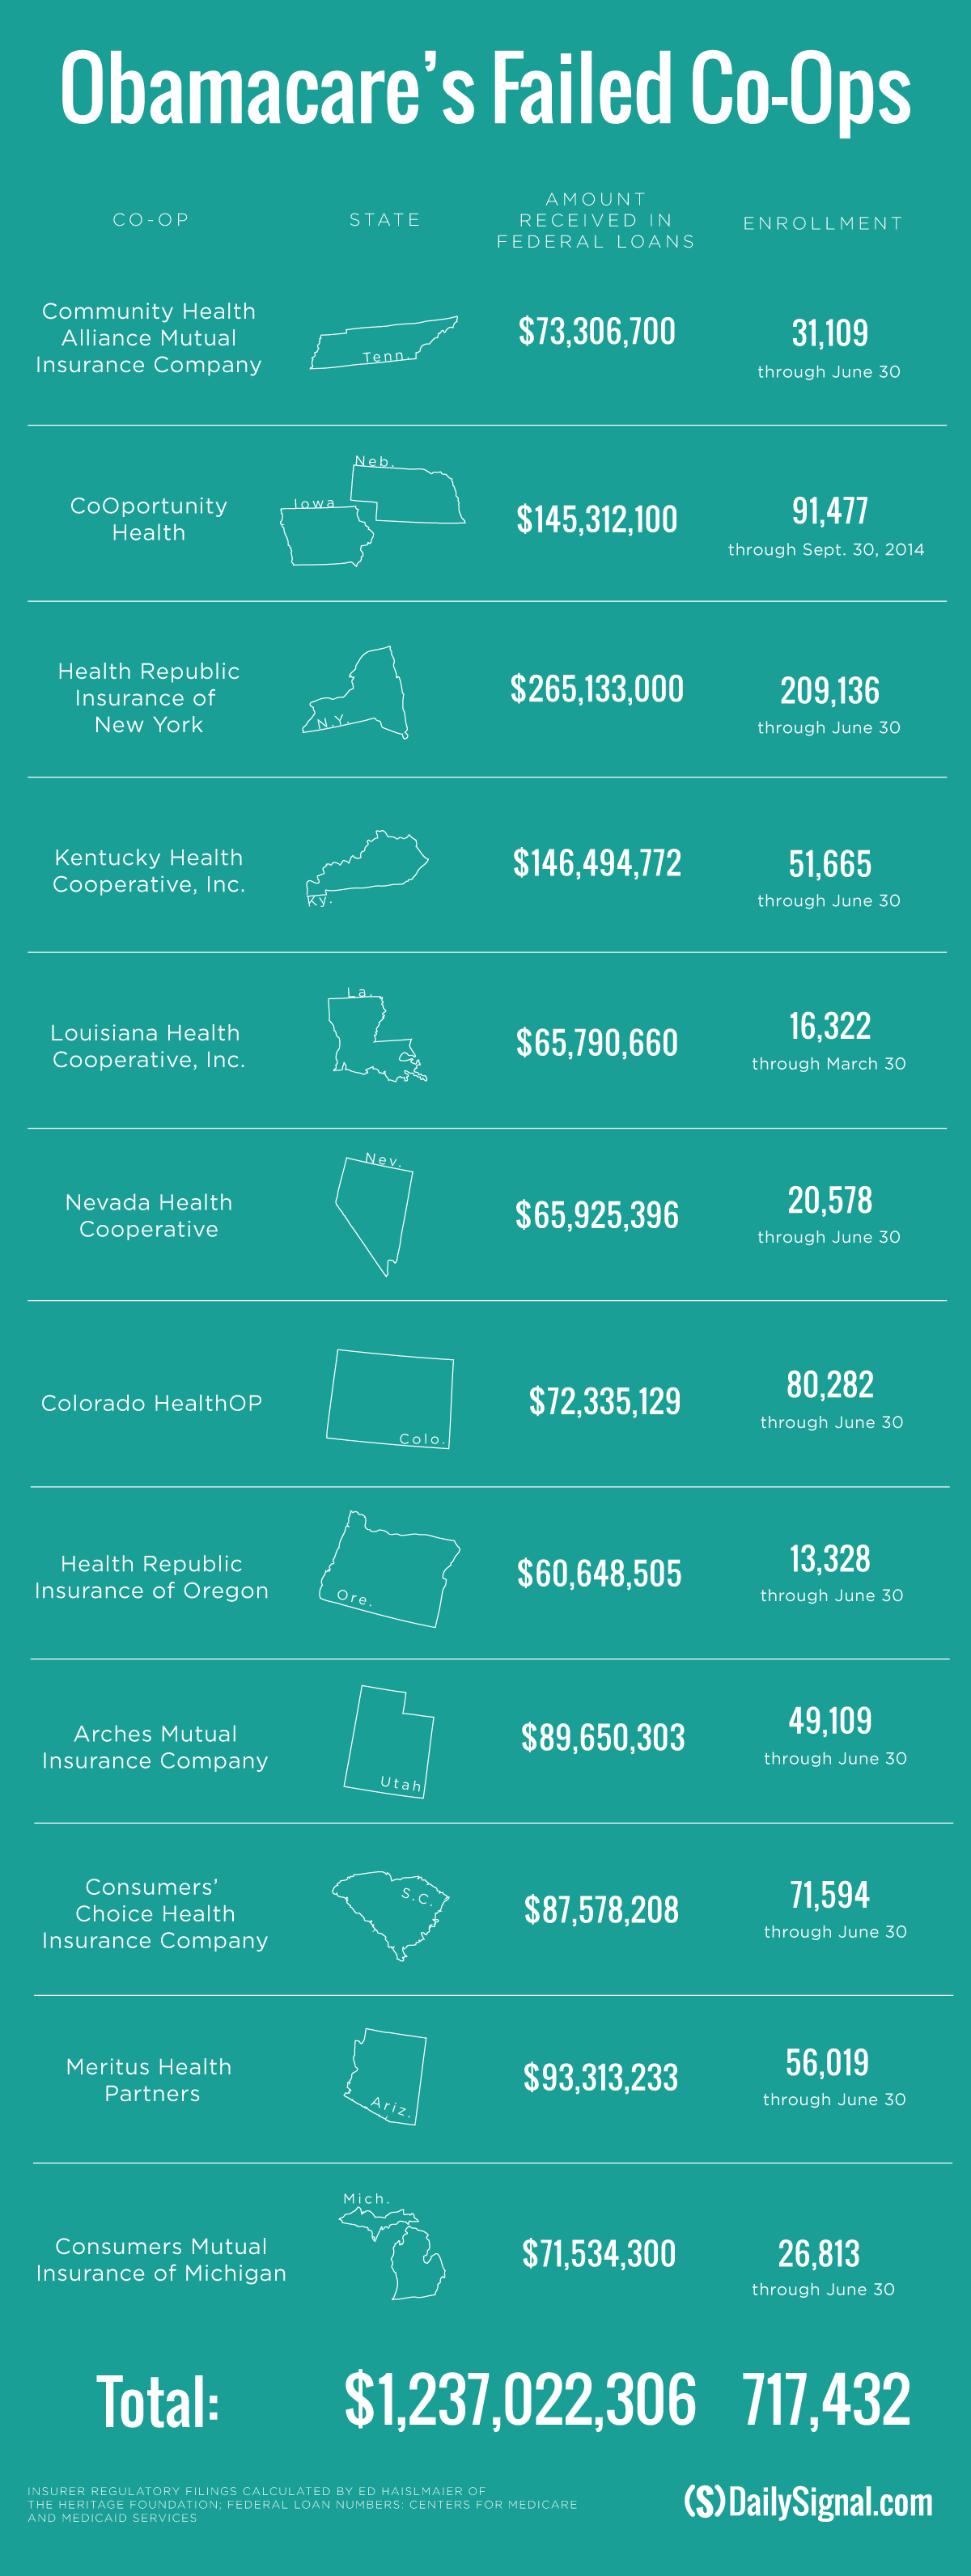
The Affordable Care Act allowed for the creation of consumer-operated and oriented plans, or co-ops, that were intended to inject competition into areas where consumers had few choices. The Centers for Medicare and Medicaid Services awarded $2.4 billion in start-up and solvency loans to the 23 co-ops that were eventually created.
Now, 12 of the 23 co-ops that opened their doors in 2013 have shuttered, and Republicans in Congress are questioning whether the taxpayers will see the $1.2 billion loaned to those failed insurers repaid.
4) Obamacare’s 2015 Enrollment Numbers
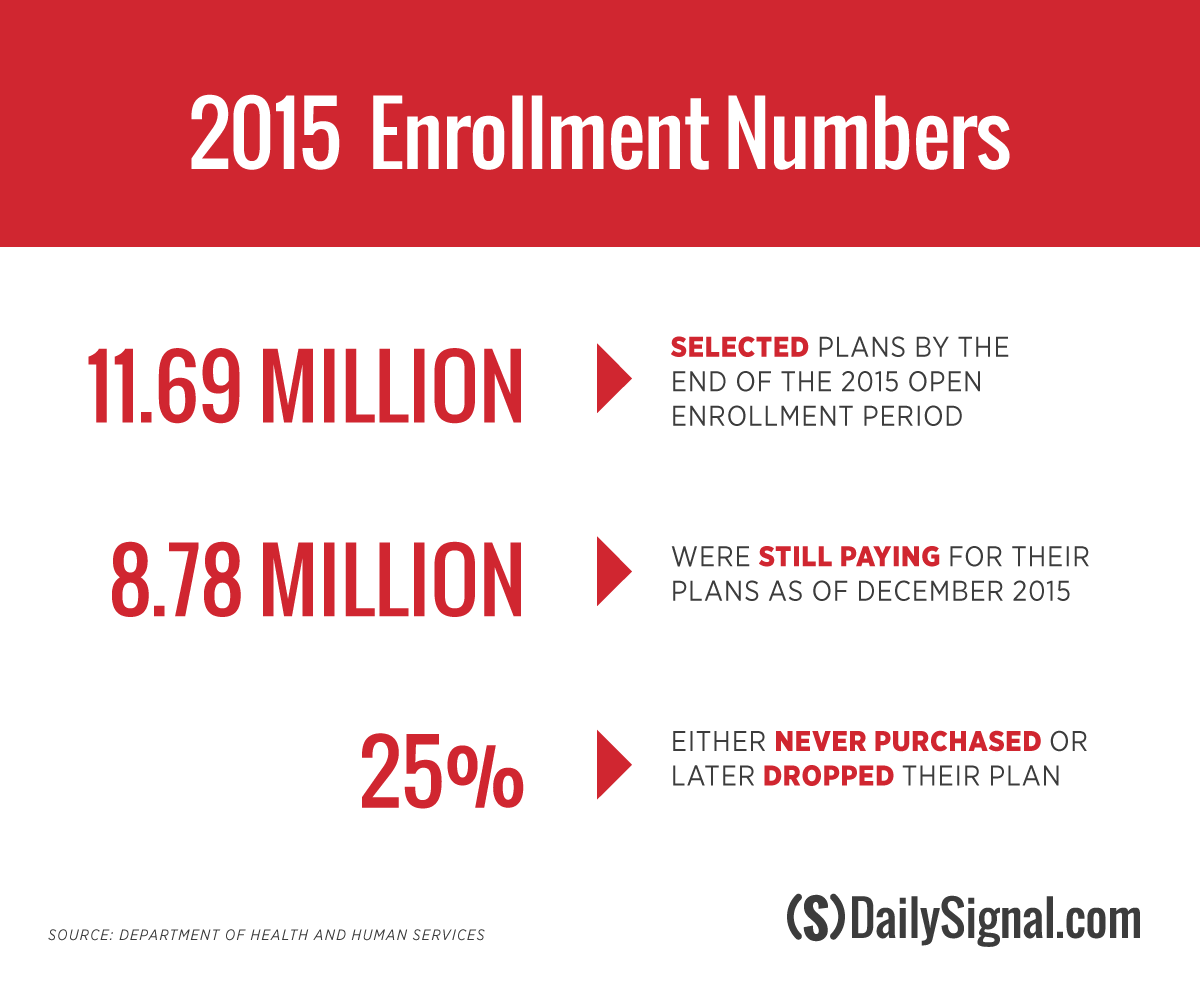
Earlier this month, the Centers for Medicare and Medicaid Services announced that nearly 8.8 million Americans had “effectuated” coverage at the end of 2015, meaning they were paying their health insurance premiums.
The agency praised this number as a sign of Obamacare’s success in expanding access to coverage.
However, health policy experts noted that there was a significant drop in the number of consumers who selected plans at the start of 2015—11.69 million—when compared to those who continued paying their premiums through the end of the year—8.78 million.
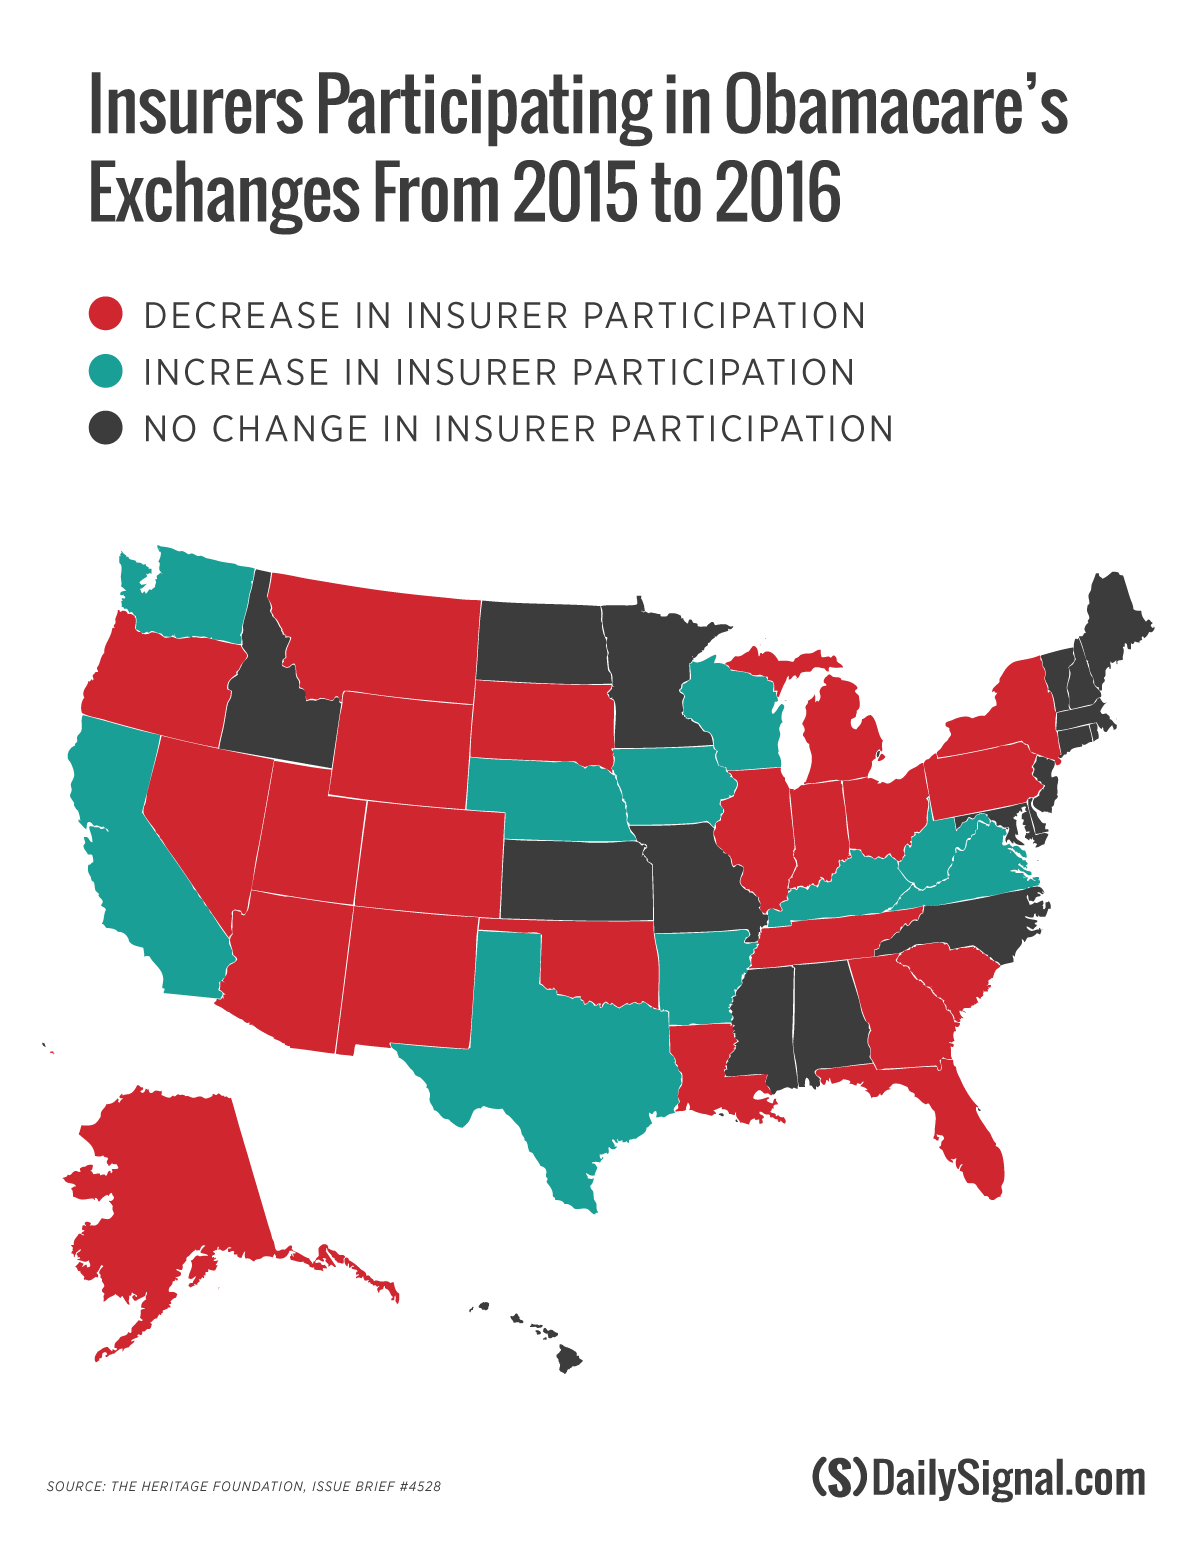
5) Insurer Participation in Each State Declined
Though Obama credited the Affordable Care Act with expanding access to health insurance and increasing competition among insurers, insurer participation in each state and the District of Columbia found that participation in the exchanges declined from 2015 to 2016.
When compared to 2015, 22 states and the District of Columbia have fewer insurers offering coverage on the exchanges in 2016. Just 10 states have more insurers offering coverage on Obamacare’s exchange.
Among the states that saw insurer participation decline from 2015 to 2016, the number of choices consumers have on the state-run or federal exchanges varies.
In Alaska, for example, just one insurance company is selling insurance to consumers in the state for 2016.
In Colorado, though, consumers can choose from eight different insurers selling coverage on the exchange this year. Both states saw fewer insurance companies selling coverage from 2015 to 2016.
Find out how many insurers are selling coverage in your state here.