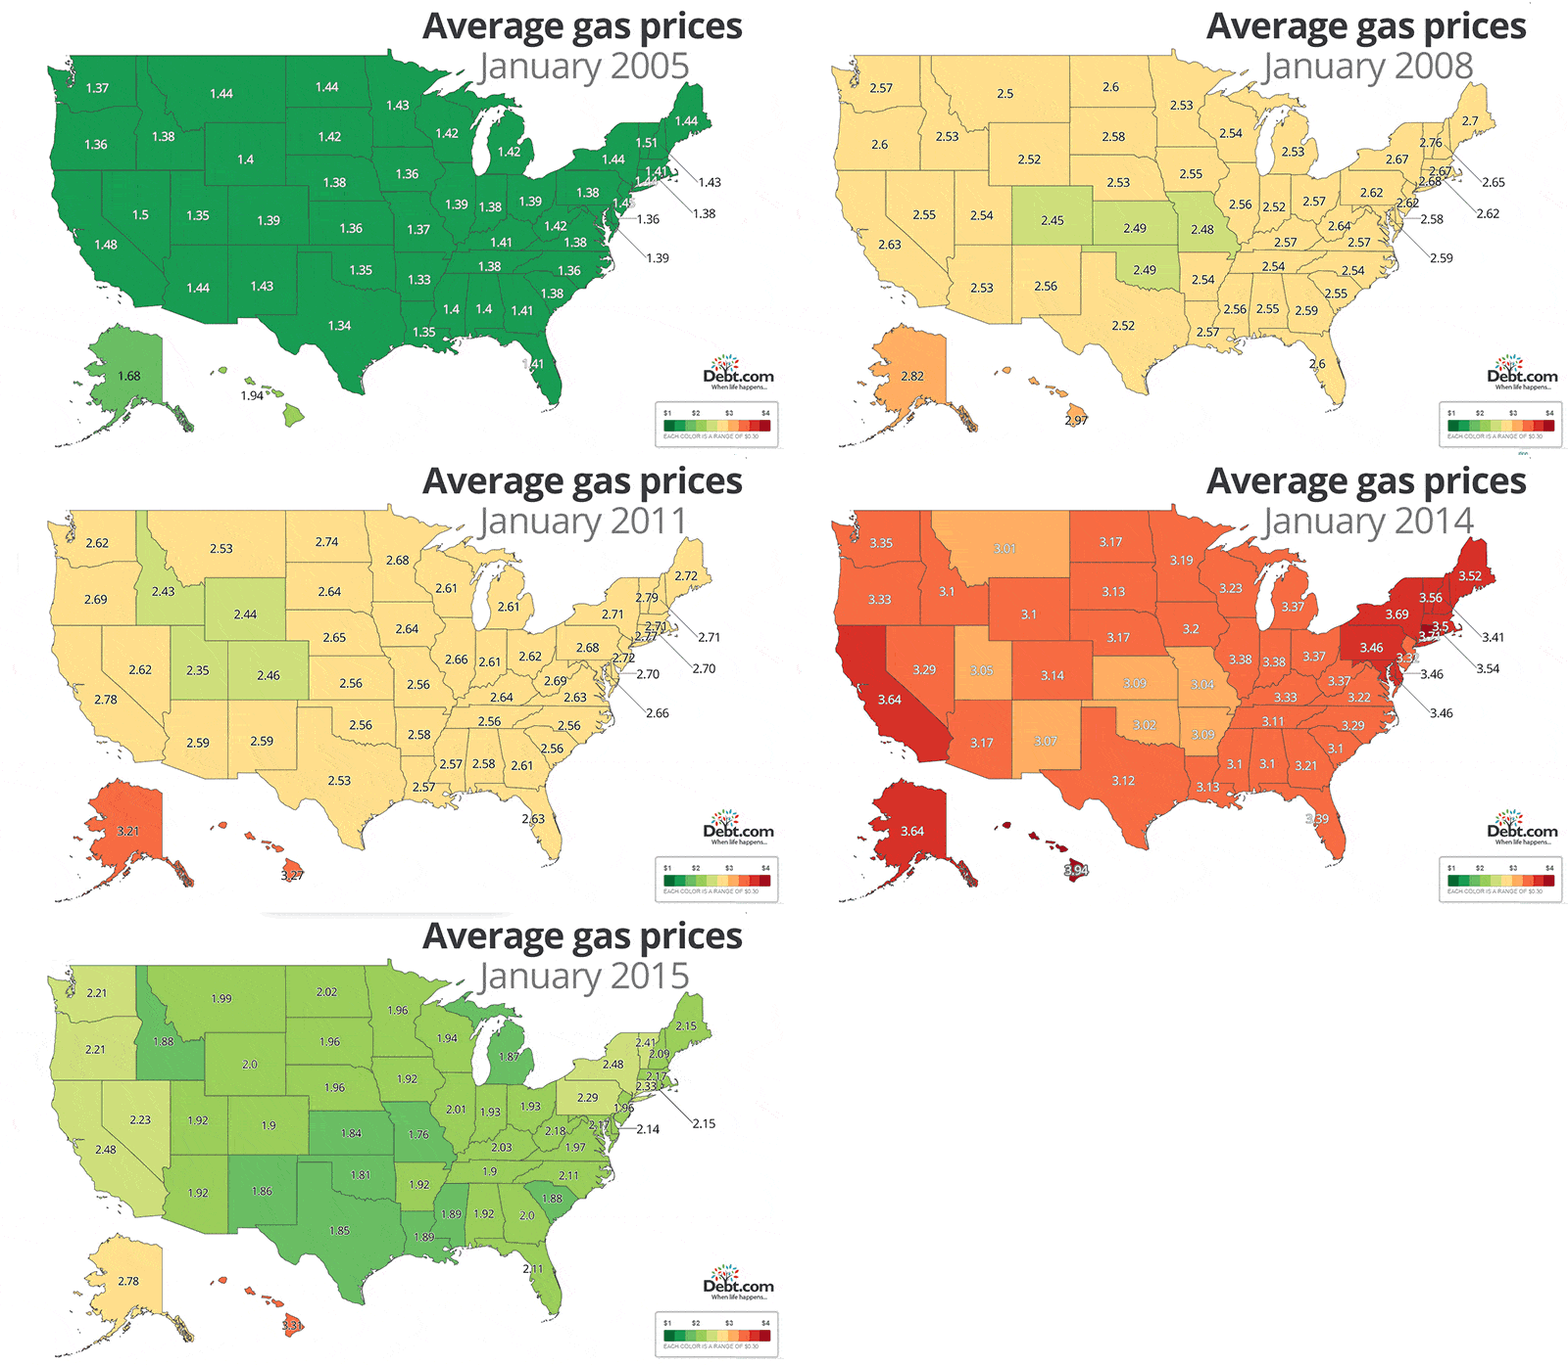
What is the average price of gas in your state? Researchers at Debt.com have put together a map to show you.
Debt.com’s interactive map allows users to see their state’s average gas price-simply by hovering their cursor over the state. Clicking a state will show you its average price for the last 10 years:
You can also see the average price in your state for the last 10 years:

While the national average for a gallon of gas is about $2.18, some states fare better or worse than others.
For example, drivers in Hawaii “consistently pay the most for gas.” They are currently paying an average of $3.31.
In addition to Hawaii, drivers in Alaska, California and the New England region pay among the highest average gas prices in the nation.
There is no one state that regularly pays the lowest price, but the researchers called Oklahoma, Utah and Missouri drivers “among the luckiest.”
Debt.com called the numbers an “average of averages,” determined using the average gas prices according to sources like GasBuddy, AAA and the U.S. Energy Information Administration.
They cited two other maps that help illustrate some the reasons behind your state’s price-the U.S. Energy Information Administration’s map of oil pipelines and refineries, and the American Petroleum Institute’s map depicting tax rates for gas.
The Daily Signal recently reported on falling gas prices, which were less than $50 a barrel last week.


