


Obamacare continues to fall short of the lofty predictions about it — and here are two new charts to prove it.
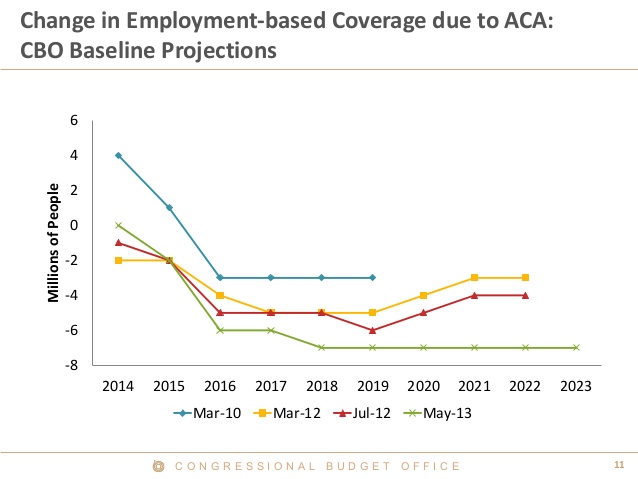
The charts, included as part of a Congressional Budget Office (CBO) presentation over the weekend, summarize the CBO’s cost estimates of the law in the three years since its passage. The charts show that in every instance, the CBO’s estimate of the number of uninsured has risen, as has the number of workers who will lose coverage under their existing employer plans:
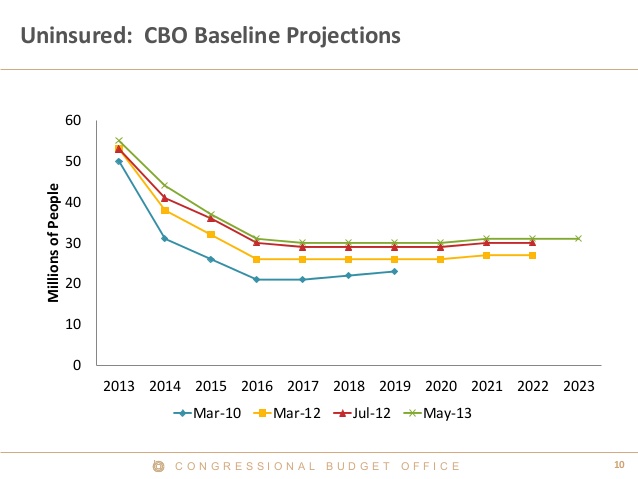
As the presentation notes, many factors affect the CBO’s cost and coverage estimates. Economic growth and the state of labor markets will determine whether individuals have access to employer-provided health care or qualify for subsidized insurance. In 2011, Congress twice changed provisions dealing with Obamacare exchange subsidies, impacting enrollment projections. And the Supreme Court’s June 2012 decision making Medicaid expansion optional for states reshuffled the number of people who might qualify for Medicaid or exchange coverage.
All that said, the CBO noted one other key change affecting its coverage estimates: “increased employer responsiveness to alternative options.” In other words, if workers can receive access to taxpayer-subsidized insurance through the exchanges, firms are more likely to pay a $2,000 penalty to the federal government rather than pay $10,000 or more to subsidize a family’s health insurance policy. If the trends the CBO identified accelerate when Obamacare takes full effect next year, the cost for federal exchange subsidies could rise by trillions more at a time when the federal government can ill afford more new spending and debt.
More workers losing their coverage and more Americans not gaining coverage—that’s not the health care “reform” President Obama promised.